Content strategy survey results: part 4
Earlier this year, I managed to coax a few of you web content professionals into responding to a survey. Since then, in a series of staggered posts, I’ve used the results from that survey to reveal a little more about who and where we all are, where we work and where our talents lie and which tasks we’re more likely to take on. Now, we’re going to find out about our educational backgrounds, and in particular how closely we believe it impacts on the work we do today.
The educational backgrounds of content strategists
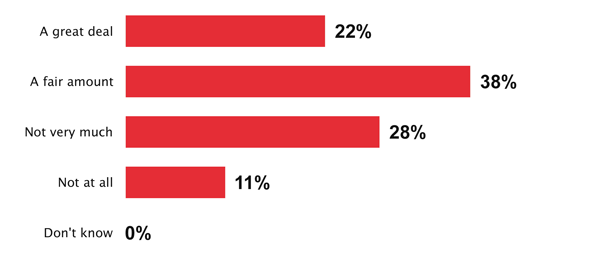
Q8. To what extent has your educational route related to your work?

Key findings
- If we’re happy to consider a combination of the figures for “A great deal” and “A fair amount” to roughly indicate a high level of relevancy, then 60% of all respondents believed their educational route closely relates to their work. I’ve tried, and so far failed, to find a set of comparative figures from elsewhere which could indicate how common it is for graduates to study something in one field, only to end up with a career in another. If anyone knows of such a study, I’d love to hear about it
Comments
- One respondent answered “Don’t know” for this question – so it’s not strictly 0%. See the data summary below for a more accurate breakdown of the figures
Matchup #1: Q1. What is your gender? vs. Q8. To what extent has your educational route related to your work?

Key findings
- 64% of all female respondents considered their educational route had “A great deal” and “A fair amount” of relevance to their work, as opposed to 56% of males
Comments
- Though it may not have been entirely obvious at first glance, vertical dashes have been used to indicate the position of the overall shares from question eight
Matchup #2: Q2. Which age bracket do you fall into? vs. Q8. To what extent has your educational route related to your work?

Key findings
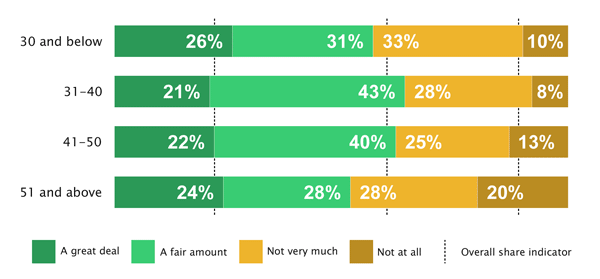
- Of the 51% share of respondents aged between 31 and 40, 64% considered their educational route had “A great deal” and “A fair amount” of relevance to their work
Comments
- The original age bracket categories have been merged to squeeze the data
- Vertical dashes have been used to indicate the position of the overall shares
Matchup #3: Q4. For what kind of organisation do you work? vs. Q8. To what extent has your educational route related to your work?

Key findings
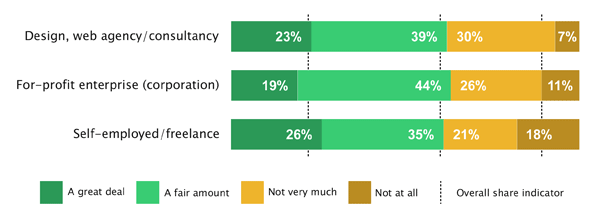
- It’s a tale of two extremes for self-employed or freelance respondents, with a combined 44% who either considered their educational route had “A great deal” of relevance to their work or “Not at all”. To be fair, the relatively small overall share belonging to this category (16%) may have contributed to these figures
Comments
- Due to insufficient data, I refrained from including the “Government agency”, “Non-profit”, “School, college, university” and “Startup” categories in this graphic
- Vertical dashes have been used to indicate the position of the overall shares
Data summary for educational relevance
| Extent of educational relevance | # | % |
|---|---|---|
| Total | 265 | 100 |
| A great deal | 59 | 22.26 |
| A fair amount | 102 | 38.49 |
| Not very much | 75 | 28.30 |
| Not at all | 28 | 10.57 |
| Don’t know | 1 | 0.38 |
| Extent of educational relevance | Male | Female | Total | |||
|---|---|---|---|---|---|---|
| # | % | # | % | # | % | |
| Total | 108 | 40.76 | 157 | 59.24 | 265 | 100 |
| A great deal | 23 | 8.68 | 36 | 13.58 | 59 | 22.26 |
| A fair amount | 38 | 14.34 | 64 | 24.15 | 102 | 38.49 |
| Not very much | 31 | 11.70 | 44 | 16.60 | 75 | 28.30 |
| Not at all | 16 | 6.04 | 12 | 4.53 | 28 | 10.57 |
| Don’t know | 0 | 0.00 | 1 | 0.38 | 1 | 0.38 |
| Relevance | -30 | 31-40 | 41-50 | 51+ | Total | |||||
|---|---|---|---|---|---|---|---|---|---|---|
| # | % | # | % | # | % | # | % | # | % | |
| Total | 51 | 19.26 | 134 | 50.57 | 55 | 20.75 | 25 | 9.43 | 265 | 100 |
| A great deal | 13 | 4.91 | 28 | 10.57 | 12 | 4.53 | 6 | 2.26 | 59 | 22.26 |
| A fair amount | 16 | 6.04 | 57 | 21.51 | 22 | 8.30 | 7 | 2.64 | 102 | 38.49 |
| Not very much | 17 | 6.42 | 37 | 13.96 | 14 | 5.28 | 7 | 2.64 | 75 | 28.30 |
| Not at all | 5 | 1.89 | 11 | 4.15 | 7 | 2.64 | 5 | 1.89 | 28 | 10.57 |
| Don’t know | 0 | 0.00 | 1 | 0.38 | 0 | 0.00 | 0 | 0.00 | 1 | 0.38 |
| Relevance | Web agency | Corporation | Self-employed | |||
|---|---|---|---|---|---|---|
| # | % | # | % | # | % | |
| A great deal | 24 | 9.06 | 11 | 4.15 | 11 | 4.15 |
| A fair amount | 41 | 15.47 | 25 | 9.43 | 15 | 5.66 |
| Not very much | 32 | 12.08 | 15 | 5.66 | 9 | 3.40 |
| Not at all | 7 | 2.64 | 6 | 2.26 | 8 | 3.02 |
| Don’t know | 1 | 0.38 | 0 | 0.00 | 0 | 0.00 |
Q9. Which subject(s) provided your highest level of educational attainment?
Description
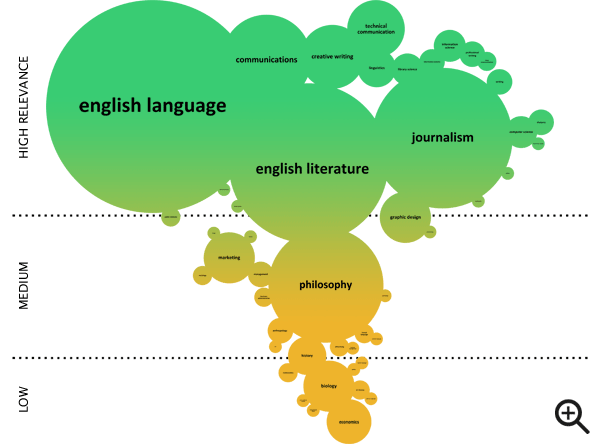
- This type of information visualization is known as a bubble race. Each bubble represents a field of study. The size of each bubble indicates how many respondents studied in this field. The vertical position of each bubble indicates how relevant respondents considered each field of study was to the work they do today
Key findings
- Despite its size, the field of technical communication provided the highest amount of “A great deal” responses. In fact, everyone who studied technical communication considered it to be highly relevant
- On the opposite end of the scale, economics provided the highest amount of “Not at all” responses
- The fields of English language and literature alone accounted for 58% of all listed fields of study
Comments
- I counted 121 different fields of study, 70 of which were omitted from this diagram due to only being mentioned once. Believe me, you’d need to possess a pair of eyes capable of spotting specks of dust on a fly’s nose from three miles away to pick them out
- Time to come clean: considering the survey’s global audience, this question was poorly worded. Somehow, in spite of this, I still received a great response. Littered amongst the replies from respondents who had successfully decoded my bizarre request were the puzzled comments of the poor souls who hadn’t have the foggiest idea what I was asking them to do. “Call me an idiot but I’m not sure what you mean here”, said one. “I’m not sure what this question means”, said another. And, in what was possibly the most damming chide of all, another asked: “Isn’t clear language a part of good survey design?”. Usually, yes
What can you do with this data?
- Study the spreadsheet on Google docs
- Post your own sketches and visualisations on the Flickr group
