Content strategy survey results: part 2
Between April and May web content professionals from six continents were surveyed about their life, work and education. In Part 1 of this series I used a colourful array of charts and maps to display the results for gender, age and location. Now, not so hot on its heels, here’s part 2 which attempts to shed some light on the working lives of today’s content strategists.
The working lives of content strategists
Q4. For what kind of organisation do you work?
")
Key findings
- Excuse me while I speculate with reckless abandon. Do these results indicate that an increasing number of respondents are getting hired by web design agencies looking to offer content strategy? Have those with the necessary skills, interests and will within those agencies begun to adopt or practice elements of it? Or better still, have they been there all along? We can only imagine how different these figures would have looked from just a year or two ago
Comments
- I now regret not adding the option for a respondent to indicate whether they are a business partner, owner or an employee. Only the self-employed or freelance respondents offered a less-than-firm indication of how content strategists actually do their work. A missed opportunity
- Eagle-eyed readers may have noticed that the figures add up to 101%. That’s what you get when you choose to round up, folks.
Q5. How many people does your organisation employ?
")
Key findings
- The largest share of respondents (31%) work in a self-employed or freelance capacity or as part of a small team of up to 10 employees
- A quarter of all respondents (25%) are practicing elements of content strategy in organisations of approximately 1001 people and above
Comments
- I can see this whole 101% issue is bothering you. If you’re partial to a few more decimal places, I suggest you scroll down for the data summary
Matchup #1: Q4. For what kind of organisation do you work? vs. Q5. How many people does your organisation employ?
")
Key findings
- 39% of the 40% overall share of respondents who work at a design, web agency or consultancy do so in a team of up to 25 employees
- 39% of the 22% overall share of respondents who work for a for-profit enterprise (corporation) do so in a team of over 3000 employees
Comments
- Interact with this visualization using IBM’s Many Eyes (requires Java)
- In a bid to to squeeze the data, I decided to merge a few of of the organisation size categories
- I also removed the organisation type for self-employed or freelance. Unsurprisingly, there were a high number of respondents in this category who also indicated they worked on their own. I’m still getting over this startling revelation
Data summaries for organisation type and size questions
| Organisation type | # | % |
|---|---|---|
| Total | 265 | 100 |
| Design, web agency/consultancy | 105 | 39.62 |
| For-profit enterprise (corporation) | 57 | 21.51 |
| Government agency | 11 | 4.15 |
| Non-profit | 16 | 6.04 |
| School, college, university | 21 | 7.92 |
| Self-employed/freelance | 43 | 16.23 |
| Startup | 8 | 3.02 |
| Other | 4 | 1.51 |
| Organisation size | # | % |
|---|---|---|
| Total | 265 | 100 |
| Self-employed/freelance | 51 | 19.25 |
| 2-10 employees | 33 | 12.45 |
| 11-25 employees | 23 | 8.68 |
| 26-50 employees | 24 | 9.06 |
| 51-100 employees | 19 | 7.17 |
| 101-300 employees | 20 | 7.55 |
| 301-800 employees | 23 | 8.68 |
| 801-1000 employees | 7 | 2.64 |
| 1001-3000 employees | 28 | 10.57 |
| More than 3000 employees | 37 | 13.96 |
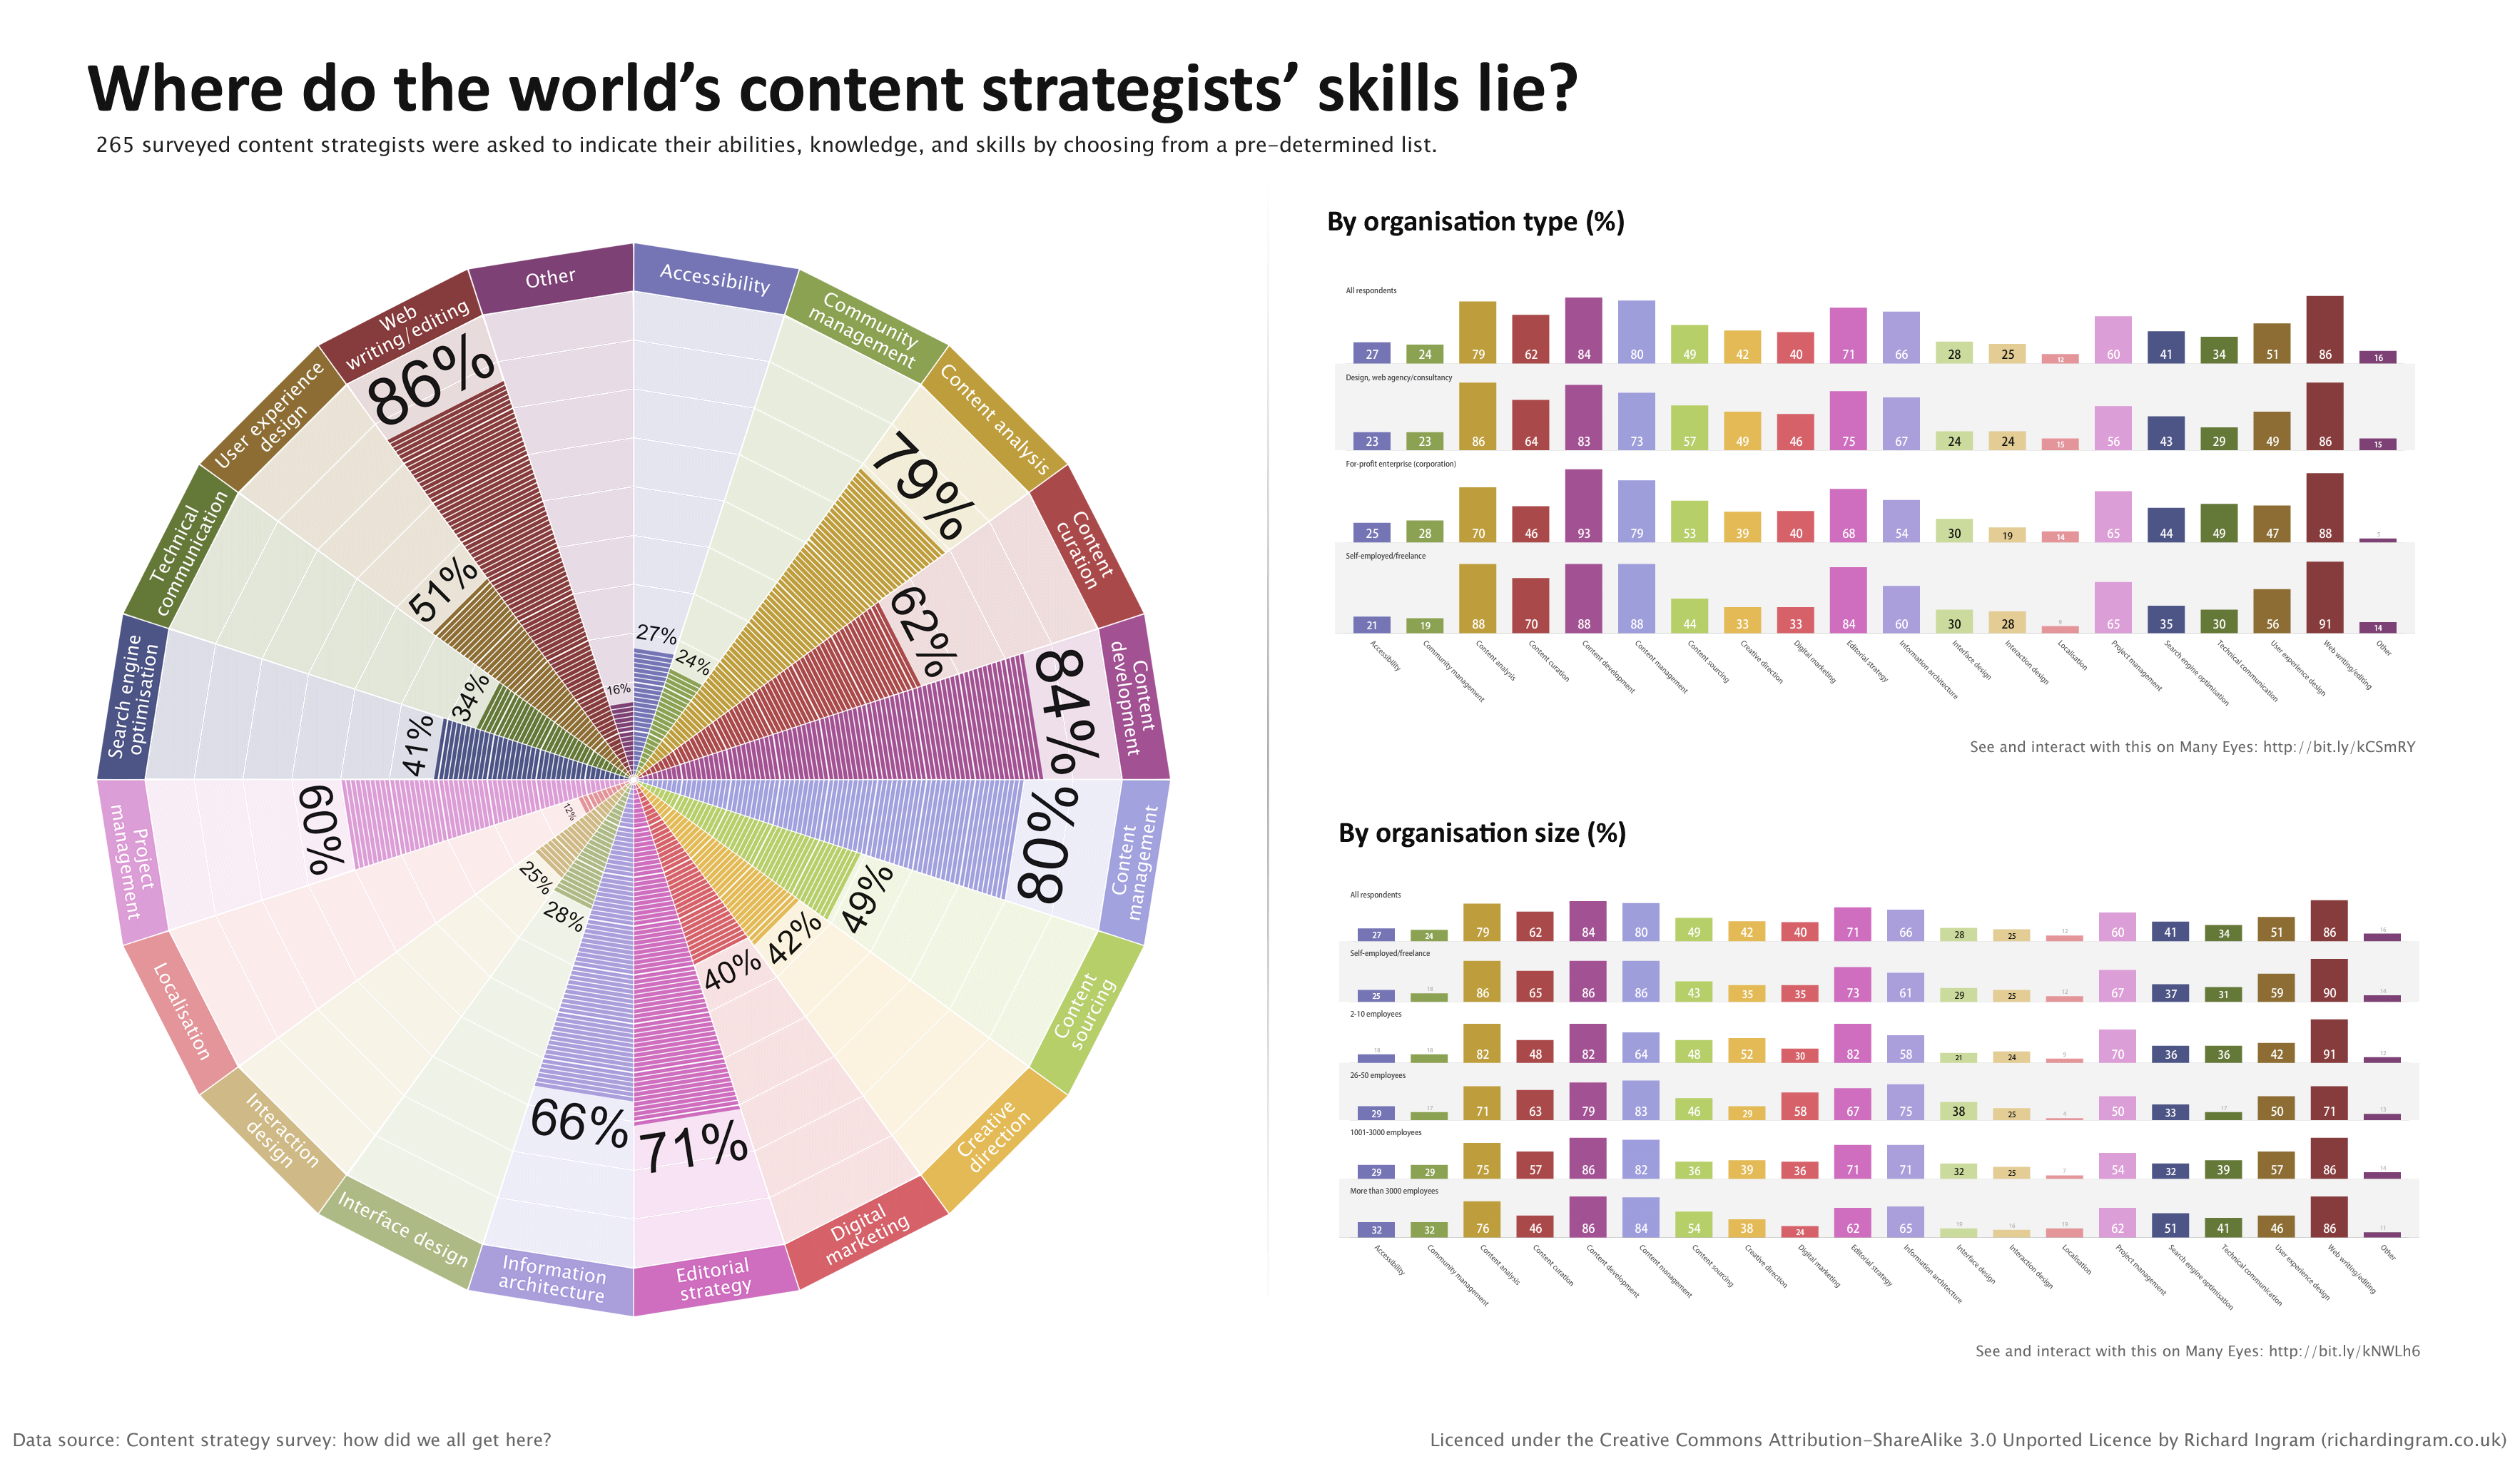
Q6. In which of the following areas are you competent?
 of respondents who indicated their abilities, knowledge and skills from a pre-determined list")
Key findings
- Just before last Friday’s close of play I decided to release this infographic to an unsuspecting and work weary audience to measure some of your initial reactions to the figures. One notable conversation centred around localisation’s meagre share. In a week when CS Forum 2011 co-organiser Destry Wion had already commented on the lack of conversations around localisation within the content strategy fraternity, the number of respondents who credited themselves with skills in this area certainly justified his concerns. Karen McGrane, Managing Partner at Bond Art + Science, later posed this pertinent question: “If content strategists (particularly in Europe) don’t get localization, who does?”. Fortunately the world can call upon experts like Lise Janody, who frequently works with large multi-language websites. She’ll be at CS Forum 2011 in London this September presenting on this very subject, as indeed did Kenneth Yau of Baddit Ltd at last year’s forum in Paris.
- While we’re on the subject, out of the 21% share of respondents from Europe, 21% indicated their competency in localisation. That’s a 9% increase on the overall share
Comments
- Respondents were invited to add an additional category (or seven). Pleasingly for me there were no recurring categories of real significance to make me lament their omission from the hulking main list. A few of the interesting submissions ranged from old favourites such as “Brand strategy” and “Social media strategy” to alternatives like “CMS training” and “Business development”. But for their entertainment value alone my personal favourites were “Whatever people decide needs to be added to my plate” and “putting client toys back in prams”. Mad skillz indeed
Matchup #2: Q4. For what kind of organisation do you work? vs. Q6. In which of the following areas are you competent?
 against respondent's abilities, knowledge and skills")
Key findings
- More of the 16% overall share of self-employed or freelance respondents credited themselves with skills in analysing, curating and managing content as well as developing an editorial strategy than their counterparts working for for-profit enterprises (22% overall share)
Comments
- Interact with this visualization using IBM’s Many Eyes (requires Java)
- Due to insufficient data, I refrained from including the “Government agency”, “Non-profit”, “School, college, university” and “Startup” categories in this graphic
Matchup #3: Q5. How many people does your organisation employ? vs. Q6. In which of the following areas are you competent?
 against respondent's abilities, knowledge and skills")
Key findings
- 82% of respondents who work in small teams of 2-10 employees credited themselves with skills in editorial strategy. That’s 11% more than the overall average
- Rather than the number of respondents practising information architecture decreasing as the size of the team grows, they actually increased
Comments
- Interact with this visualization using IBM’s Many Eyes (requires Java)
- Once more I decided to merge a few of of the organisation size categories to help squeeze the data
Data summary for areas of competency
| Competency | # | % |
|---|---|---|
| Accessibility | 71 | 26.79 |
| Community management | 64 | 24.15 |
| Content analysis | 210 | 79.25 |
| Content curation | 164 | 61.89 |
| Content development | 222 | 83.77 |
| Content management | 213 | 80.38 |
| Content sourcing | 129 | 48.68 |
| Creative direction | 111 | 41.89 |
| Digital marketing | 105 | 39.62 |
| Editorial strategy | 189 | 71.32 |
| Information architecture | 174 | 65.66 |
| Interface design | 74 | 27.92 |
| Interaction design | 65 | 24.53 |
| Localisation | 32 | 12.08 |
| Project management | 160 | 60.38 |
| Search engine optimisation | 109 | 41.13 |
| Technical communication | 90 | 33.96 |
| User experience design | 134 | 50.57 |
| Web writing/editing | 227 | 85.66 |
| Other | 42 | 15.85 |
What can you do with this data?
- Study the spreadsheet on Google docs
- Post your own sketches and visualisations on the Flickr group
Update (15/06/11): Added details of Lise Janody’s presentation on localisation at CS Forum 2011.
Pingback: And so it begins (on Monday) | Richard Ingram | Shut the door on your way out, Cicero…
Very nice piece of work, Richard!
While I’m generally not a big fan of infographics, this one does show very nicely the many different aspects of a comprehensive content strategy campaign.